

We are one of the largest Polish companies and a leading media and telecommunications group in the region. We have ca. 6 million B2B and B2C contract customers and companies from our Group provide a total of over 20 million active services.
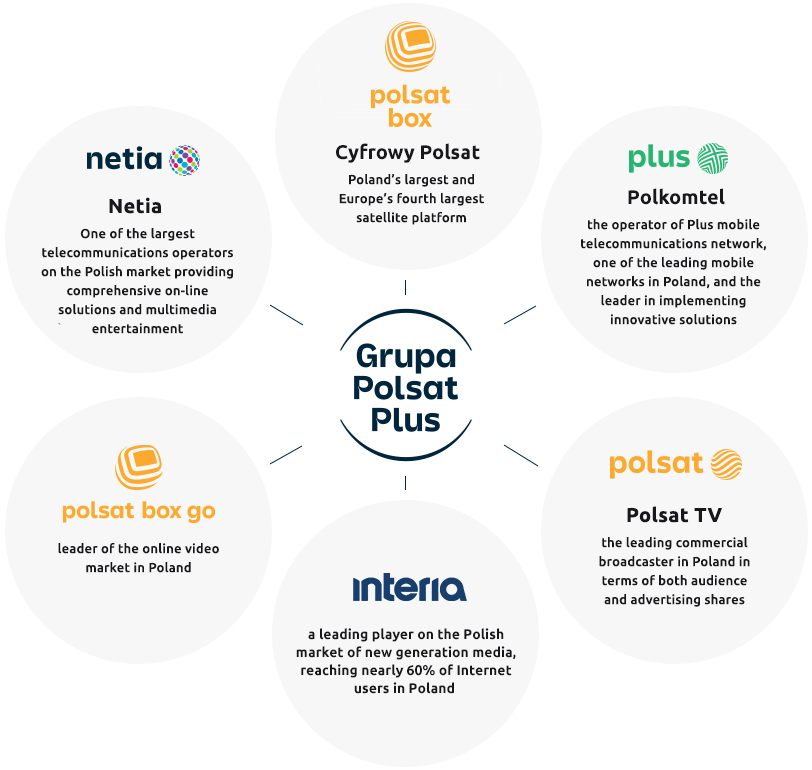
The Group consists of the following companies and brands:
We want to create and deliver high quality commodities: high-speed and reliable connectivity, the most attractive and unique content and entertainment, clean and affordable energy and other services and commodities for the home and for individual and business customers, using state-of-the-art technologies to provide top quality services that meet the changing needs and expectations of our customers, so as to maintain the highest possible level of their satisfaction. Concurrently, in line with the concept of ESG, we want to create the value of our Group in a sustainable manner taking into account and addressing environmental, social, responsible and transparent business issues, to the benefit of local society and all our Stakeholders.
Key data
| (million PLN) | 2019 | 2020 | 2021 | 2022 | 2023 |
|---|---|---|---|---|---|
| Selected financial data | |||||
| Revenue | 11,676.1 | 11,962.9 | 12,444.0 | 12.915,3 | 13,626.3 |
| EBITDA | 4,196.7 | 4,191.9 | 7,699.63 | 3.471,2 | 3,231.2 |
| EBITDA Margin | 35.9% | 35.0% | 61.9%3 | 26,9% | 23.7% |
| Profit from operating activities | 1,967.0 | 1,886.2 | 5,796.3 | 1.642,2 | 1.311,6 |
| Net profit | 1,114.6 | 1,146.2 | 4,414.5 | 901,1 | 311.6 |
| Capital expenditures1 | 1,231.6 | 1,217.9 | 1,158.8 | 1,114.4 | 1,601.9 |
| Average number of employees2 | 7,231 | 7,402 | 7,498 | 7.648 | 8,020 |
| Stock data | |||||
| Market capitalization e/y (thous. PLN) | 17,868.9 | 19,365.4 | 22,205.0 | 11.262,4 | 7,885.6 |
| Basic and diluted earnings per share (PLN) | 1.74 | 1.79 | 6.95 | 1.62 | 0.57 |
| Year-end price (PLN) | 27.94 | 30.28 | 34.72 | 17.61 | 12.33 |
[1] Capital expenditures represent payments for our investments in property, plant and equipment and intangible assets. It does not include expenditure on purchase of reception equipment leased to our customers, which are reflected in the cash flow from operating activities, or payments for telecommunication concessions.
[2] The average employment of permanent workers not engaged in production in Cyfrowy Polsat Group, excluding workers who did not perform work in the reporting period due to long-term absences.
[3] Including one-off gain on disposal of Polkomtel Infrastruktura in the amount of PLN 3,680.6 million.
KPI
| 2019 | 2020 | 2021 | 2022 | 2023 | |
|---|---|---|---|---|---|
| B2C AND B2B SERVICES SEGMENT | |||||
| Contract services for B2C customers | |||||
| Total number of B2C RGUs (EOP) [thous.], incl. | 12,902 | 13,169 | 13,465 | 13,285 | 13,083 |
| Pay TV | 5,336 | 5,355 | 5,264 | 5,049 | 4,843 |
| Mobile telephony | 5,578 | 5,810 | 6,195 | 6,238 | 6,246 |
| Internet | 1,988 | 2,004 | 2,006 | 1,998 | 1,994 |
| Number of B2C customers (EOP) [thous.] | 6,087 | 6,004 | 6,047 | 5,934 | 5,795 |
| ARPU per B2C customer [PLN] | 62.9 | 64.5 | 68.2 | 70.8 | 72.6 |
| Churn in B2C subsegment | 7.2% | 6.9% | 6.9% | 7.0% | 7.6% |
| RGU saturation per one B2C customer | 2.12 | 2.19 | 2.23 | 2.24 | 2.26 |
| Prepaid services | |||||
| Total number of RGUs (EOP) [thous.], incl.: | 2,658 | 2,618 | 2,666 | 2,691 | 2,646 |
| Pay TV | 161 | 114 | 90 | 82 | 98 |
| Mobile telephony | 2,416 | 2,446 | 2,537 | 2,578 | 2,522 |
| Internet | 81 | 58 | 39 | 31 | 26 |
| ARPU per prepaid RGU [PLN] | 15.4 | 15.5 | 16.2 | 17.5 | 17.6 |
| Contract services for B2B customers | |||||
| Total number of B2B customers (EOP) [thous.] | 68.7 | 69.3 | 68.9 | 69.1 | 68.8 |
| ARPU per B2B customer [PLN] | 1,400 | 1,381 | 1,390 | 1,406 | 1,454 |
| MEDIA SEGMENT: TELEVISION AND ONLINE | |||||
| TV channels | |||||
| Audience share1 | 24.3% | 23.9% | 24.6% | 22.5% | 22.0% |
| Advertising market share2 | 27.9% | 28.1% | 28.0% | 28.7% | 28.6% |
| Online – internet portals3 | |||||
| Average number of users [millions] | 9.6 | 14.7 | 20.2 | 20.9 | 20.9 |
| Average number of page views [millions] | 145 | 884 | 1.931 | 2.045 | 1,941 |
[1] NAM, All 16‐59 (2018-2020 All 16‐49), all day, SHR%; excluding partnership channels, include both live broadcasting and broadcasting during 2 consecutive days (i.e. Time Shifted Viewing); starting from September 2021 incl. the TV audience out of home (OOH – out of home viewing); internal analysis
[2] Our estimates based on Starcom/Publicis Group data
[3] Data from Gemius/PBI and Mediapanel surveys; data for the periods prior to the acquisition of Interia Group in July 2020 for Polsat Group standalone. Data for the periods after the acquisition of Interia Group for Polsat-Interia Group; number of users – real users (RU) indicator


